


Accept crypto with CoinGate
Accept crypto with confidence using everything you need in one platform.
Where Crypto Payments Come From: The 2026 Country Map
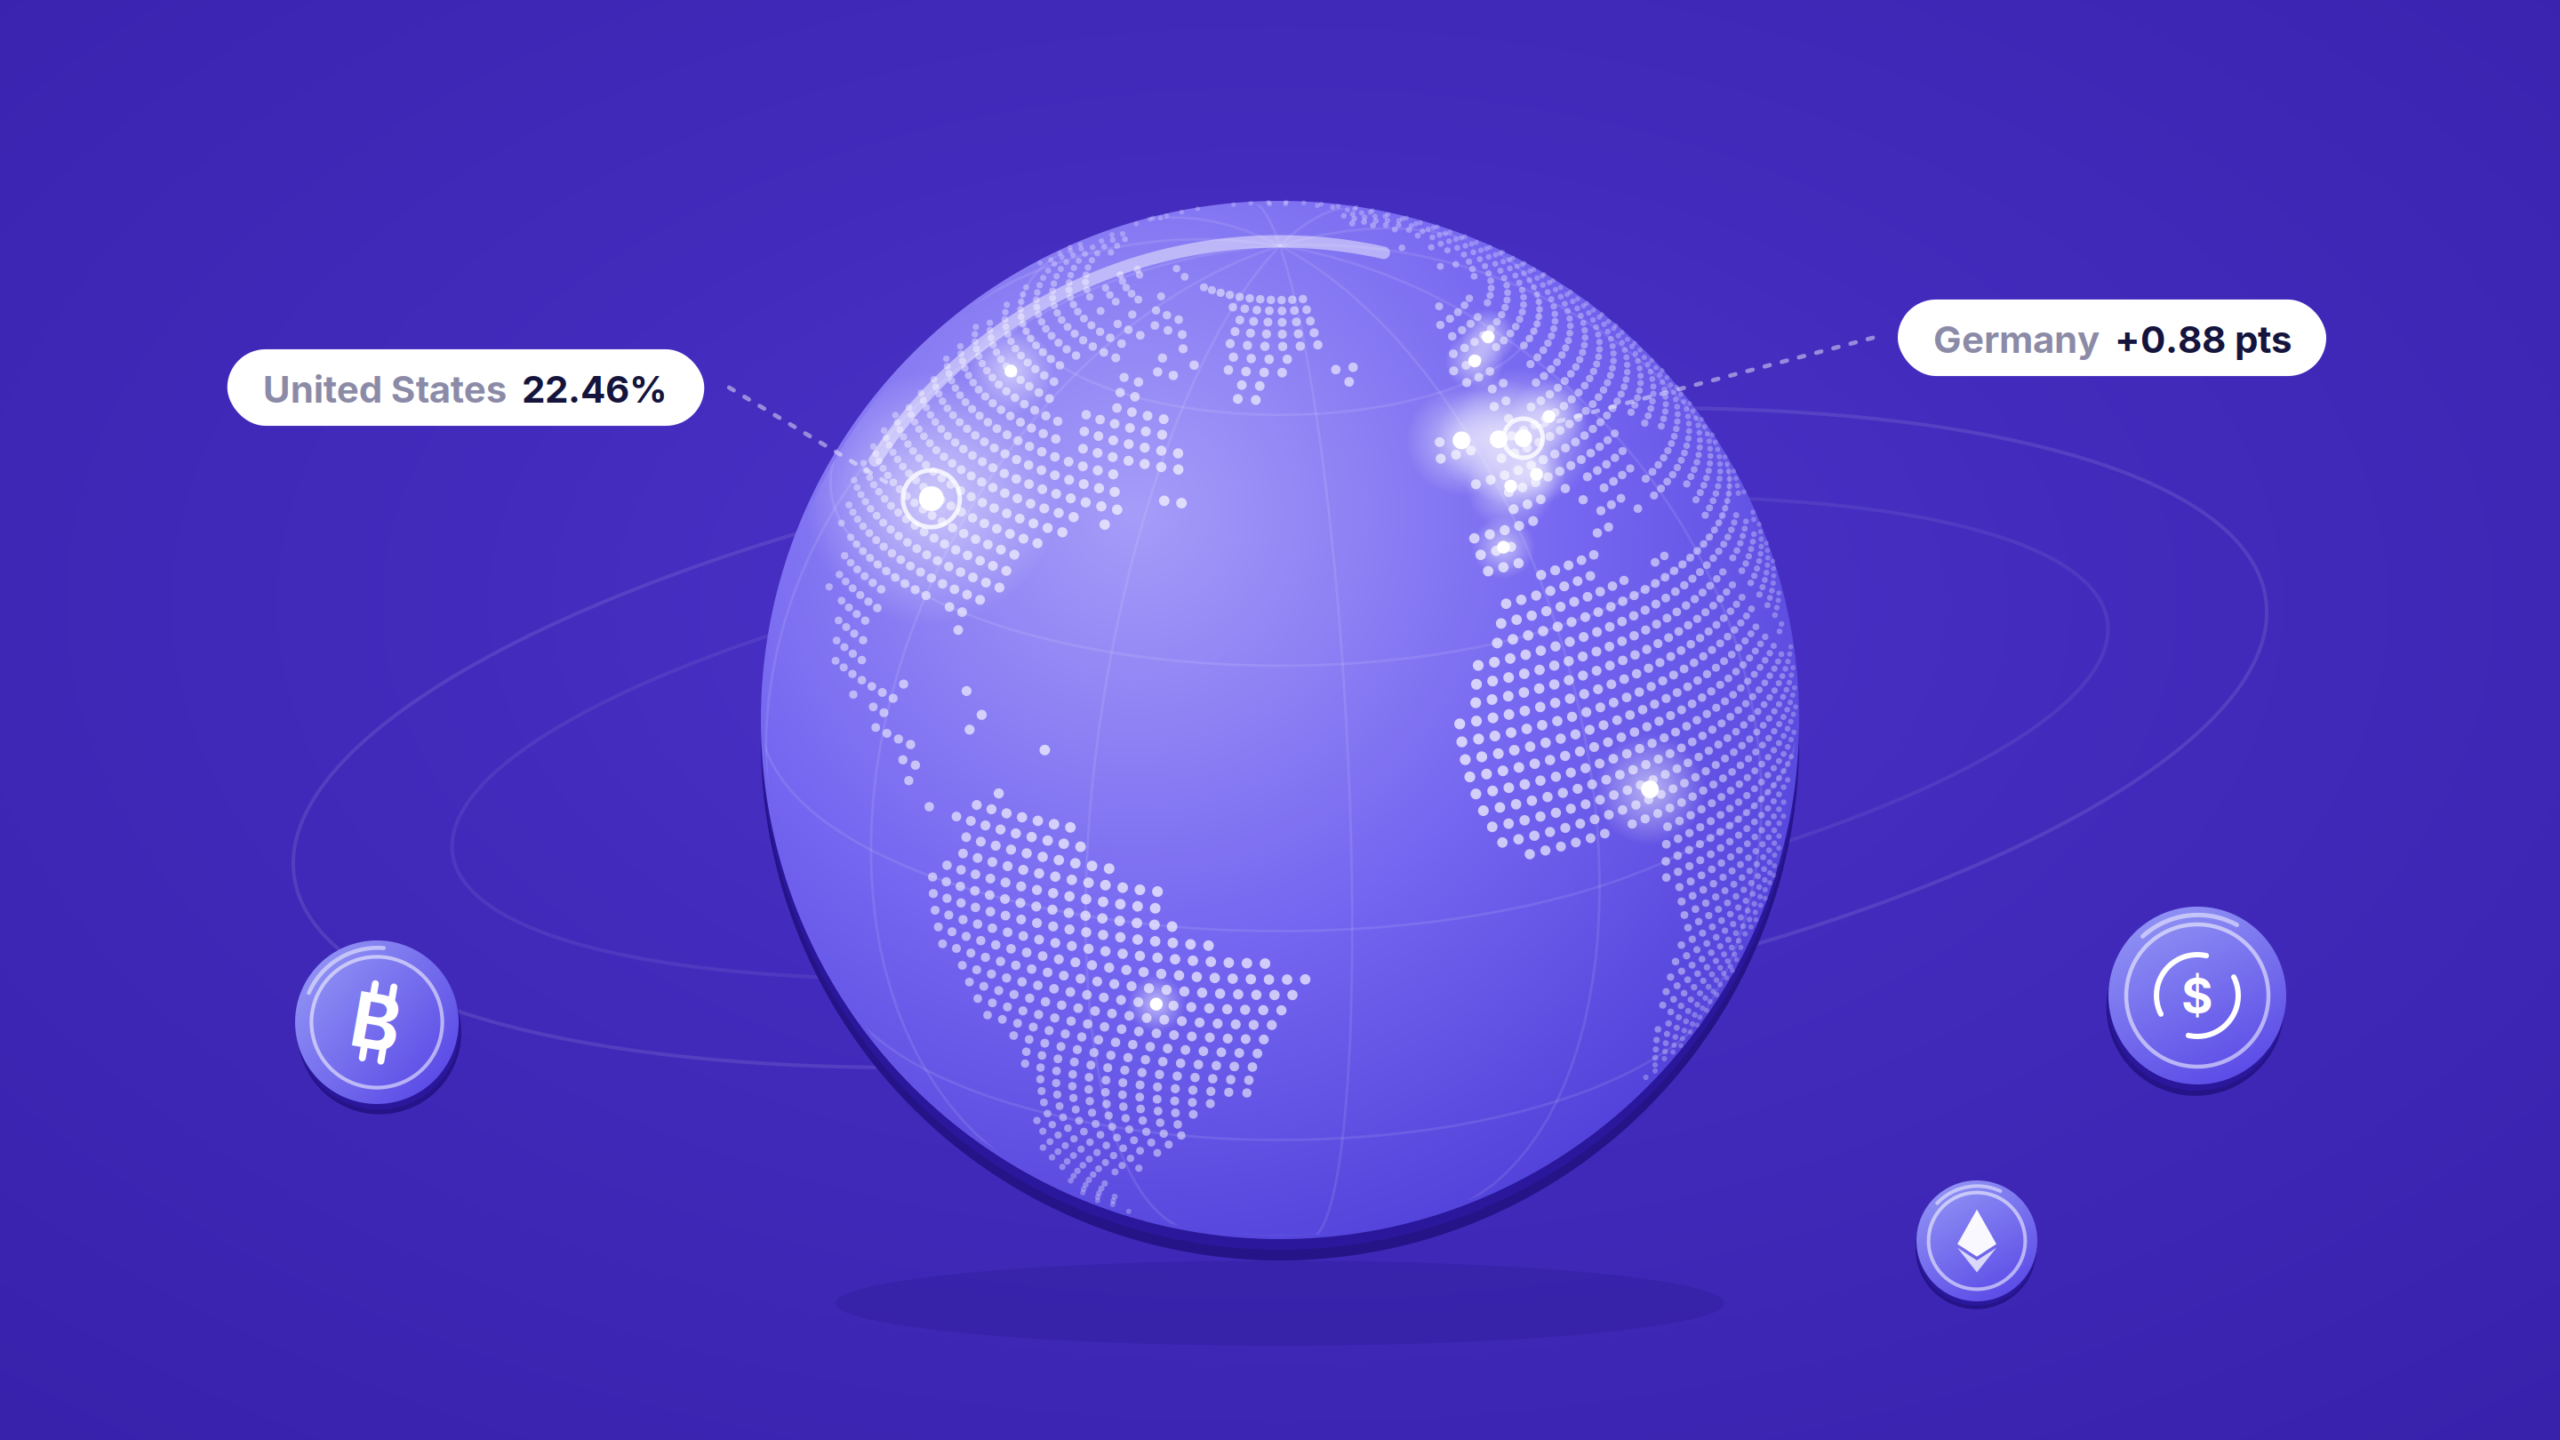
Before a business turns crypto on, somebody always asks the same question. Will my customers actually use it, and where are they?
We answered it last year in our 2025 regional report. This is the 2026 edition, built on nearly 1.6 million paid orders from the twelve months to the end of August 2026, with the twelve months before them alongside so you can see what moved.
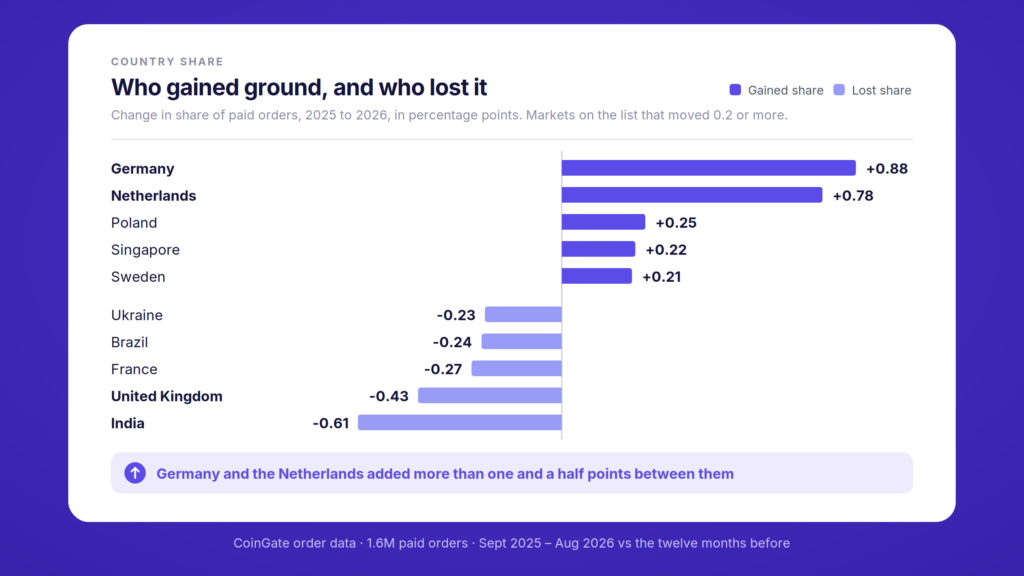
Europe gained, India and the UK slipped, and the United States did not move at all. The more useful half comes one table further down, in what people actually pay with.
Wondering whether your market is on this list? Open a CoinGate account.
The biggest markets, and what changed
Twenty-one countries rather than twenty, because Italy and Finland finish level at 1.09%.
| Country | Share 2026 | Share 2025 | Change | Median order |
|---|---|---|---|---|
| United States | 22.46% | 22.48% | flat | 12.19 EUR |
| Germany | 7.17% | 6.29% | +0.88 | 14.49 EUR |
| Netherlands | 5.33% | 4.54% | +0.78 | 18.36 EUR |
| Nigeria | 4.41% | 4.40% | flat | 8.86 EUR |
| United Kingdom | 4.29% | 4.72% | -0.43 | 14.43 EUR |
| France | 2.87% | 3.14% | -0.27 | 14.79 EUR |
| India | 2.82% | 3.43% | -0.61 | 10.85 EUR |
| Canada | 2.71% | 2.62% | +0.09 | 15.41 EUR |
| Ukraine | 2.12% | 2.34% | -0.23 | 20.85 EUR |
| Poland | 2.06% | 1.80% | +0.25 | 14.64 EUR |
| Hong Kong | 1.91% | 1.73% | +0.19 | 18.13 EUR |
| Australia | 1.57% | 1.60% | flat | 16.09 EUR |
| Singapore | 1.46% | 1.24% | +0.22 | 18.25 EUR |
| Japan | 1.40% | 1.42% | flat | 17.04 EUR |
| Spain | 1.39% | 1.34% | +0.06 | 16.92 EUR |
| Turkey | 1.37% | 1.42% | flat | 14.87 EUR |
| Switzerland | 1.25% | 1.12% | +0.13 | 17.92 EUR |
| Sweden | 1.24% | 1.03% | +0.21 | 16.56 EUR |
| Brazil | 1.18% | 1.42% | -0.24 | 9.02 EUR |
| Italy | 1.09% | 1.14% | flat | 16.75 EUR |
| Finland | 1.09% | 0.92% | +0.17 | 17.48 EUR |
The United States did not move. 22.48% to 22.46%, across two years and more than three million orders. It is still more than a fifth of everything we process and more than three times the next country.
Continental Europe mostly gained. Seven of the ten continental European countries on the list grew their share: Germany, the Netherlands, Poland, Switzerland, Sweden, Spain and Finland. Germany and the Netherlands between them added more than one and a half points. France and Ukraine went the other way, and Italy held.
The falls are the other half of the story. India lost the most ground on the list, then the United Kingdom, then France and Brazil. None of them collapsed, but the direction is consistent. Just outside the table, Thailand fell further than France did and lost three in ten of its orders.
Every region pays with something different
This is the part that catches people out. There is no global default coin.
Two notes before the table. It covers the last six months, March to August 2026, because the list of assets at our checkout changed during the year and the older months would blend two different checkouts. And Binance Pay is counted as its own option. A shopper who pays through the Binance app is choosing Binance Pay rather than a coin and a network, so we keep those orders apart from on-chain USDC.
| Country | Most used | Second |
|---|---|---|
| United States | Bitcoin 31.4% | USDC 17.3% |
| Germany | TRX 21.3% | Litecoin 20.1% |
| Netherlands | USDC 21.9% | TRX 21.4% |
| Nigeria | USDC 30.8% | Litecoin 25.4% |
| United Kingdom | Bitcoin 22.9% | Litecoin 21.5% |
| France | Litecoin 22.3% | USDC 20.4% |
| India | USDC 23.2% | Binance Pay 18.6% |
| Canada | Bitcoin 29.3% | Ethereum 19.4% |
| Ukraine | USDC 35.2% | TRX 27.7% |
| Poland | USDC 27.3% | Litecoin 24.6% |
| Hong Kong | USDC 43.5% | TRX 29.2% |
| Australia | Bitcoin 20.5% | Litecoin 16.2% |
| Singapore | USDC 27.1% | TRX 22.3% |
| Japan | USDC 32.8% | TRX 21.7% |
| Spain | USDC 25.1% | Bitcoin 19.1% |
| Turkey | TRX 41.5% | USDC 18.8% |
| Switzerland | Bitcoin 24.9% | Litecoin 18.9% |
| Sweden | Bitcoin 23.0% | USDC 20.2% |
| Brazil | USDC 25.5% | Bitcoin 18.0% |
| Italy | Bitcoin 23.2% | USDC 21.8% |
| Finland | TRX 26.5% | USDC 23.2% |
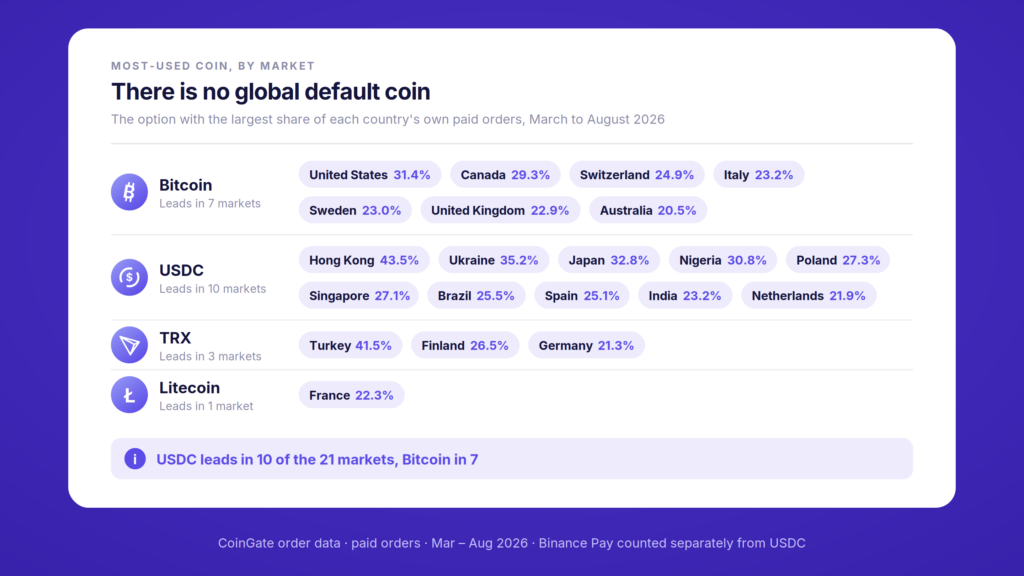
Bitcoin still leads in the US, Canada, the UK and Australia. It also comes first in Switzerland, Sweden and Italy. In the US it leads by a distance, 31.4% against 17.3% for USDC.
Across Asia, the pair is USDC and TRX. Hong Kong, Singapore and Japan all put USDC first and TRX, the Tron network’s own coin, second. In Hong Kong USDC takes 43.5% of orders. Ukraine has the same pair, at 35.2% and 27.7%. India shares the USDC lead but splits differently, with Binance Pay second at 18.6%.
TRX also leads in Germany, Finland and Turkey, and only Turkey is clear-cut. About four in ten Turkish orders are paid in TRX, 41.5% over the six months, and it stays near that level whichever merchants you count. Germany’s lean is not new either. Our 2025 report already had 9% of all TRX orders coming from Germany.
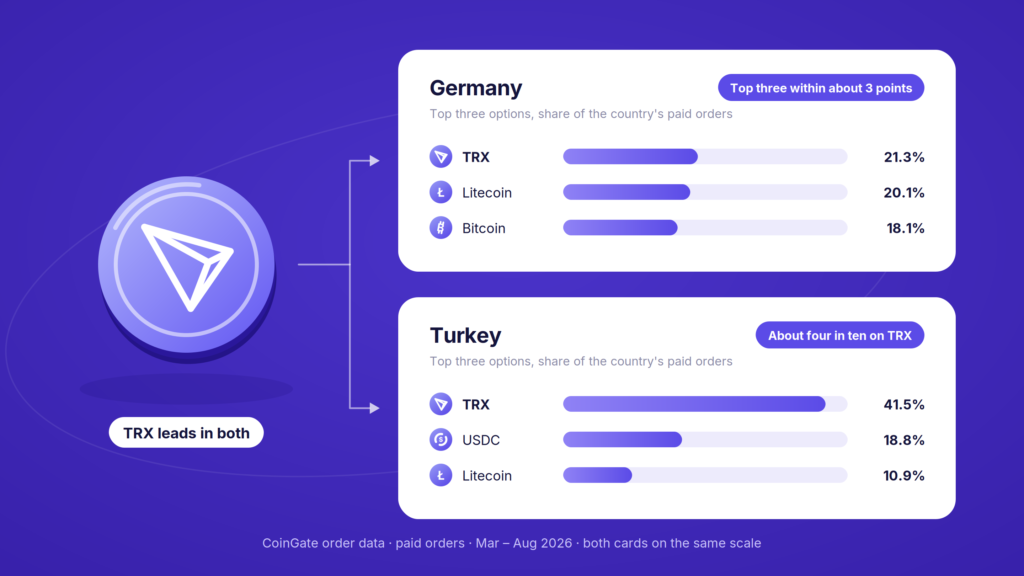
In Germany, the Netherlands and France, nothing leads for long. The top three options in each sit within about three points of each other, and first place changes depending on which merchants you count. A merchant selling into any of the three cannot get away with offering one coin.
Litecoin comes second in six of the twenty-one, from Germany and the UK to Poland, Switzerland, Australia and Nigeria, and first in France. That fits its record. Litecoin has been at least the third most-used coin at our checkout every year since 2023.
Nigeria’s first place has changed hands. Litecoin led Nigeria across the full twelve months, and still leads once the largest merchants are set aside. Over the last six months USDC moved ahead. The Litecoin habit itself is not new: our 2025 report had it at 22% of Nigerian orders.
Outside the table, Binance Pay is the main way people pay in several markets. About seven in ten orders from Venezuela arrive through it, and between four and six in ten from Pakistan, Egypt, Bangladesh and Colombia. If your customers are there, Binance Pay matters more than any single coin.
How long each of these takes to arrive is a separate question, and we measured that one too.
Order count and order value are different questions
The last column of the first table is easy to skim past, and it may be the most useful one.
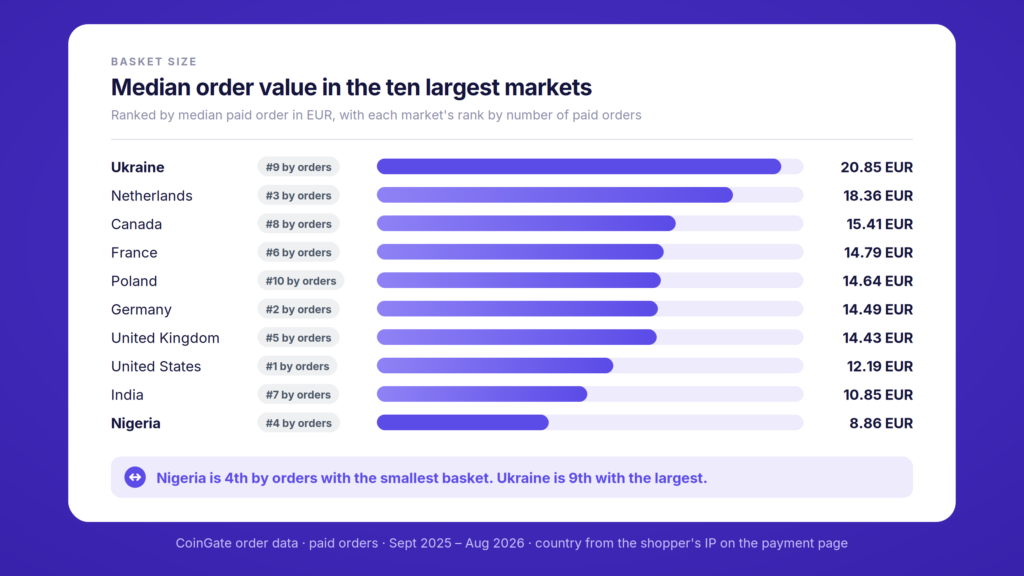
Ukraine has the largest median order on the list at 20.85 EUR. Nigeria has the smallest at 8.86 EUR, with Brazil just above it at 9.02 EUR. That is a gap of more than two to one. Just outside the table, Romania’s median is higher still, at 24.25 EUR.
So if you are sizing a market, count and value point in different directions. Nigeria is fourth by order count and last on the list by median basket. Ukraine is ninth by count and first by basket.
What to do with this
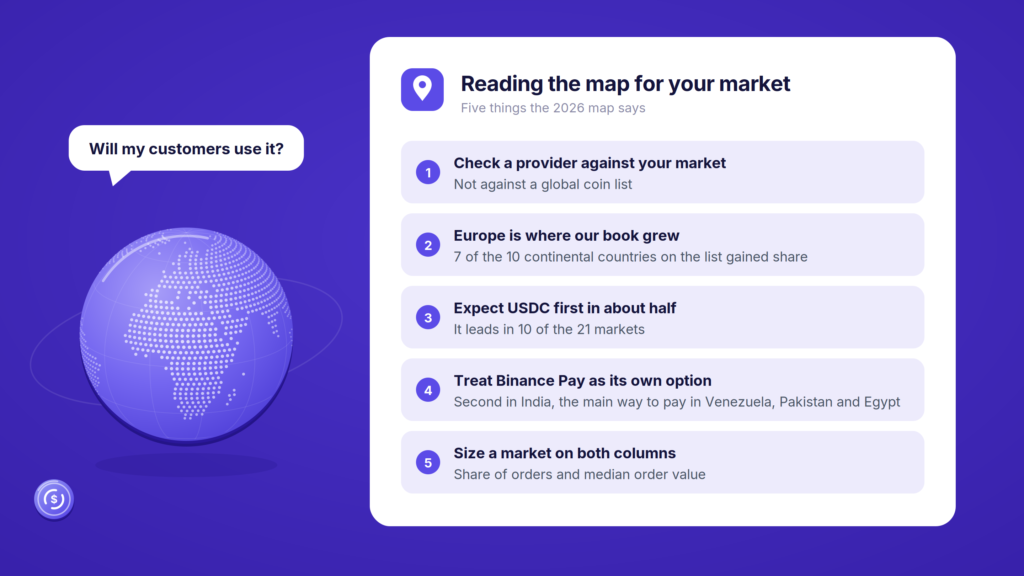
- Check a provider against your market, not against a global coin list. A checkout that works for the United States leans on Bitcoin. One that works for Hong Kong leans on USDC and TRX.
- Europe is where our book grew. Seven of the ten continental European countries on the list gained share, led by Germany and the Netherlands.
- Expect USDC first in about half of these markets. It leads in ten of the twenty-one, including Hong Kong, Singapore, Japan, India and Ukraine. If you are deciding which stablecoins to take, we compared them here.
- Treat Binance Pay as its own option. It is second in India and the main way people pay in Venezuela, Pakistan and Egypt.
- Size a market on both columns. Share of orders and median order value point in different directions often enough that using one alone will mislead you.
Method
Every figure comes from CoinGate’s own order data, paid orders only. The country table compares 1 September 2025 to 31 August 2026 (1,598,628 paid orders) with the twelve months immediately before it (1,499,691). Shares are of orders with a known country, which leaves out 0.07% of this year’s orders and 0.54% of last year’s. “Flat” means a move of less than 0.05 points either way. Median order is the median order value in euros.
Country comes from the shopper’s IP address on their first visit to the payment page. The asset table covers March to August 2026 and shows each option’s share of that country’s own paid orders, with Binance Pay counted separately.
We checked the year-on-year moves against merchant mix. Every gain and fall named above also shows up inside the same merchants’ own books, apart from Sweden, where most of the gain came from which merchants grew. The flat US total hides movement: inside individual merchants’ books its share went up in some and down in more. We also re-ran every first place with each country’s largest merchants left out, which is where the notes on Germany, the Netherlands, France, Nigeria and Turkey come from.
Two limits. IP country records where somebody was when they opened the payment page, which is not always where they live, and a VPN or a business trip will move an order. And this is our book rather than the whole market, so a provider with a different merchant mix would draw a different map. For the whole book in one place, see our 2025 report and H1 2026 report.
So, will your customers use it? If they are in any of these twenty-one markets, people there already pay this way, and every coin in these tables is on our checkout. What changes from one market to the next is which one they reach for first.
Selling into one of these markets? Start with us.
Accept crypto with CoinGate
Accept crypto with confidence using everything you need in one platform.